The Witness Gap
One night on the bench: a bend the digital instruments graded as wreckage — 60% of lines off-pitch, zero fields of color lock — displayed near-clean on a CRT. Two witnesses, both right.
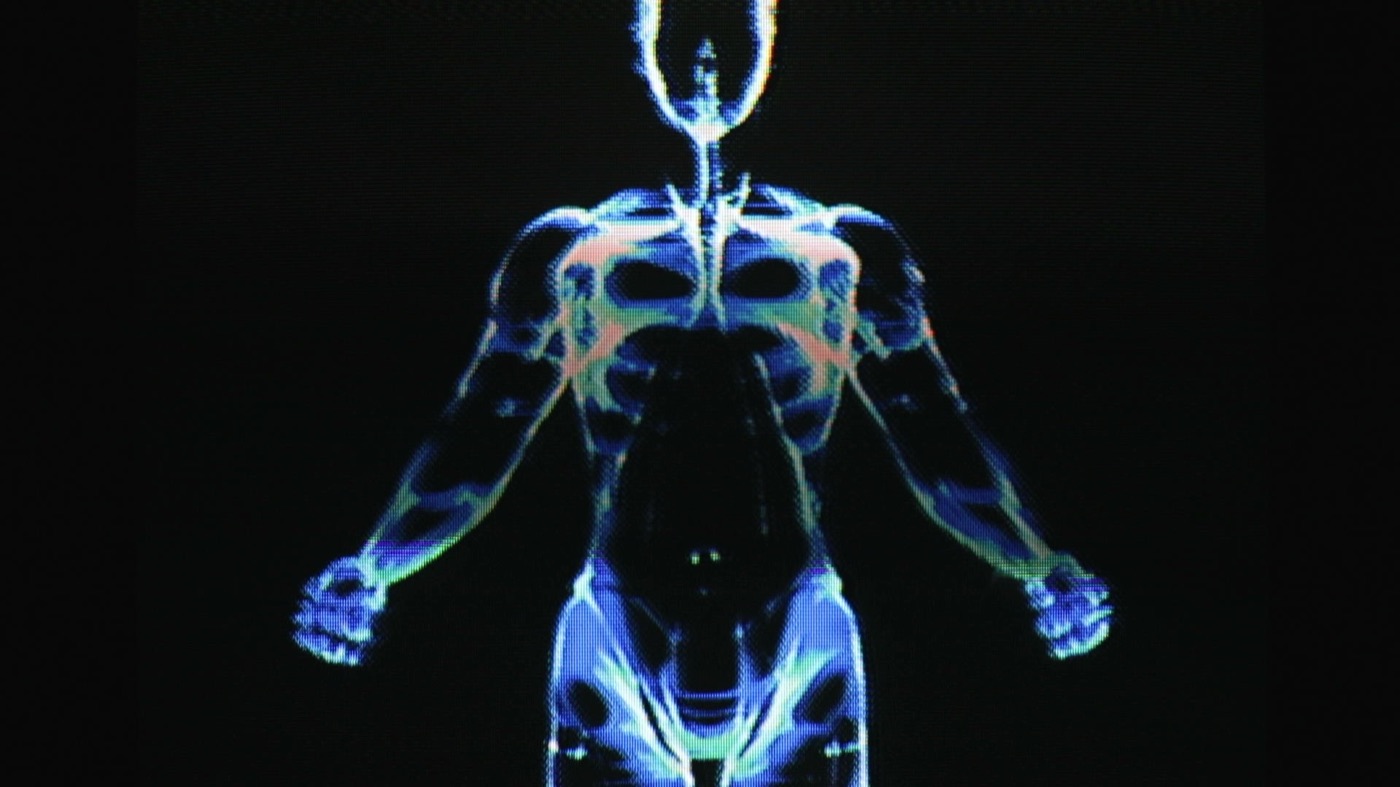
FIG. 1 — The exhibit. Photographed off a Trinitron’s screen at the moment described below. 470pF + 330Ω from the point labeled Purple to ground; the rose bloom across the chest is the bend twisting the color subcarrier.
Three instruments watched the same signal that night. They did not agree.
The setup: a relay-switched bend instrument — a bank of capacitors and resistors that can be latched, in any combination, between one point inside a composite video device and ground — with the output split two ways. One leg went to a CRT. The other went into the capture chain: a tapboard, an FPGA sampling raw composite at 13.5 MS/s, 10-bit, and two pieces of software downstream of it. The first is a line reader, which measures every scanline’s period and grades it against spec. The second is a color decoder that locks to the burst and reconstructs the picture the way a studio instrument would — it either locks a field or it doesn’t.
At 470pF in series with 330Ω, from the Purple point to ground, the signal hit what I can only call a sweet spot. Here is what each witness reported.
The line reader graded 60% of the lines off-pitch.
The color decoder could not lock a single field. Asked to decode the capture, it returned zero frames. Not degraded frames — zero.
The CRT displayed the picture in FIG. 1.
By the standards of the two digital witnesses, this signal was structurally destroyed. Timing broken on more lines than not; color reference unusable. By the standard of the CRT, it was a near-clean picture with a rose bloom in it.
Neither witness is wrong. They are answering different questions. A decoder’s job is to judge a signal: hold every line against the specification, refuse anything that fails it, because downstream equipment depends on that refusal. A CRT’s sync circuits exist to forgive one: they were engineered for weak antennas, long cable runs, tapes stretched thin — a receiver that gave up on imperfect timing would never have survived in a living room. So the flywheel keeps spinning through lines the reader flunks, the tube paints whatever voltage arrives, and a signal that fails 60% of a pitch test still resolves into a figure you can name. The bend was structurally loud and visually masked. The gap between those two verdicts is where this kind of work lives, and the picture only exists inside it.
For calibration, here is what the capture chain sees when the signal is decodable. All grayscale figures are raw luma, straight from the capture instrument.
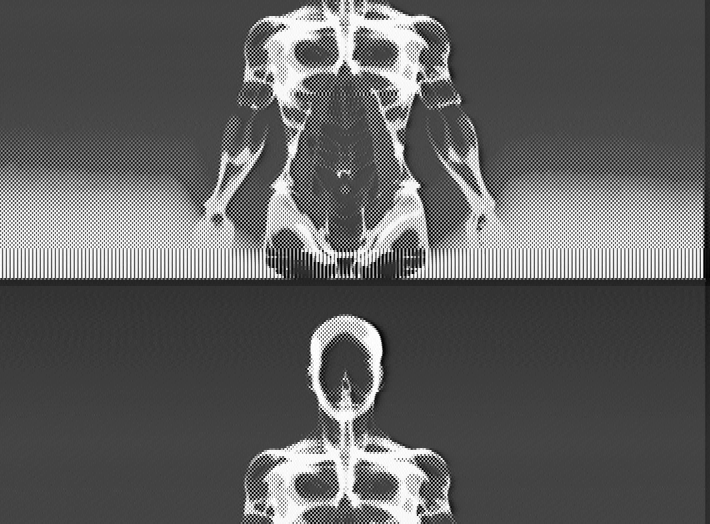
FIG. 2 — The source figure, no bend engaged. Reader decode from the raw 13.5 MS/s capture.
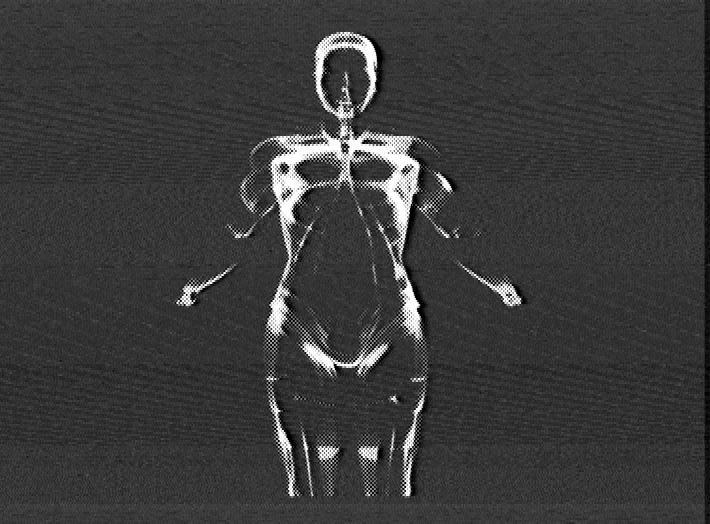
FIG. 3 — The etching effect: the same figure with the bend measured at +31% high-frequency energy. 100pF, gentle drive.
The dose-response is cleanest on bars. One capacitor value at a time:
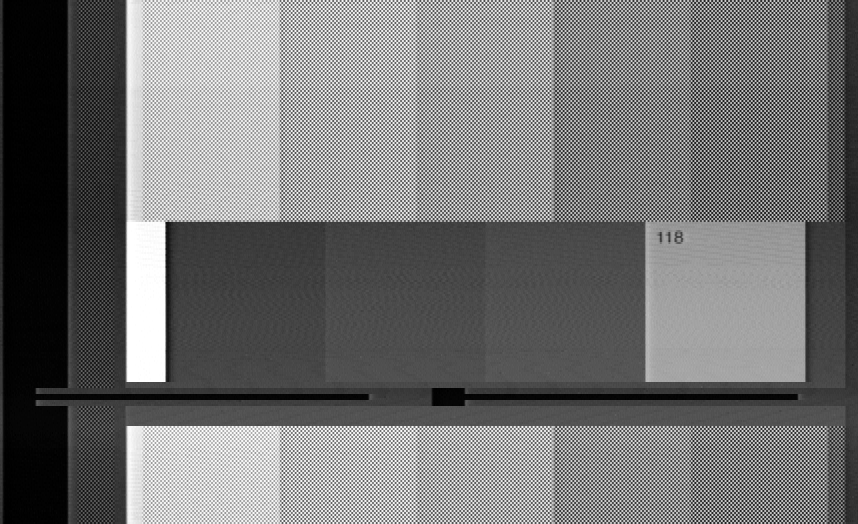
FIG. 4 — Control. Bars through the chain with no bend engaged.
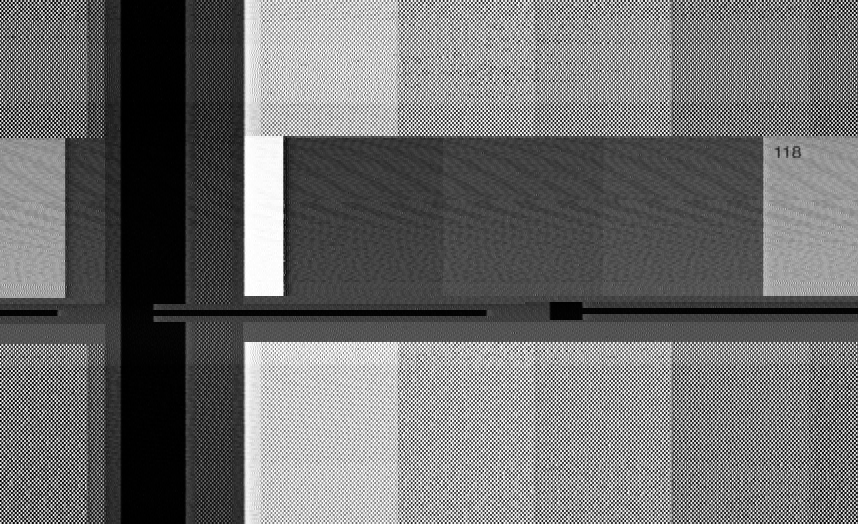
FIG. 5 — Ring onset. 20pF to ground; the edges begin to oscillate.
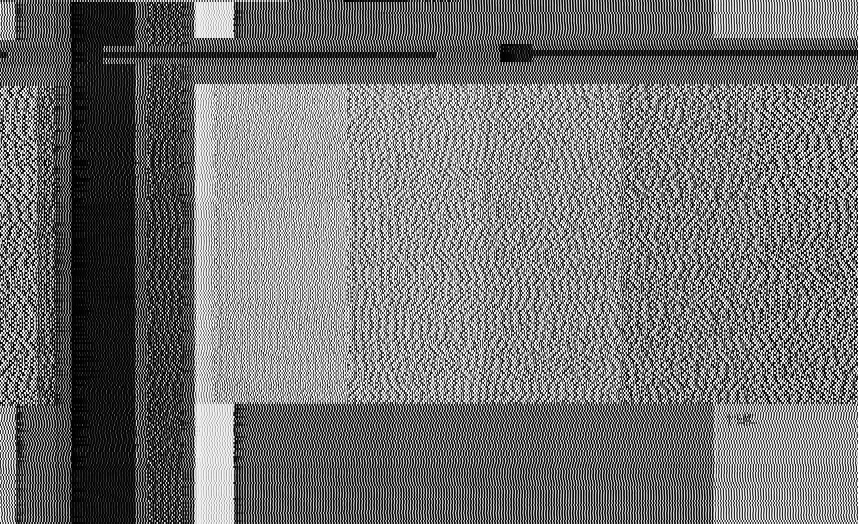
FIG. 6 — Full oscillation. 100pF; the ringing overtakes the picture content.
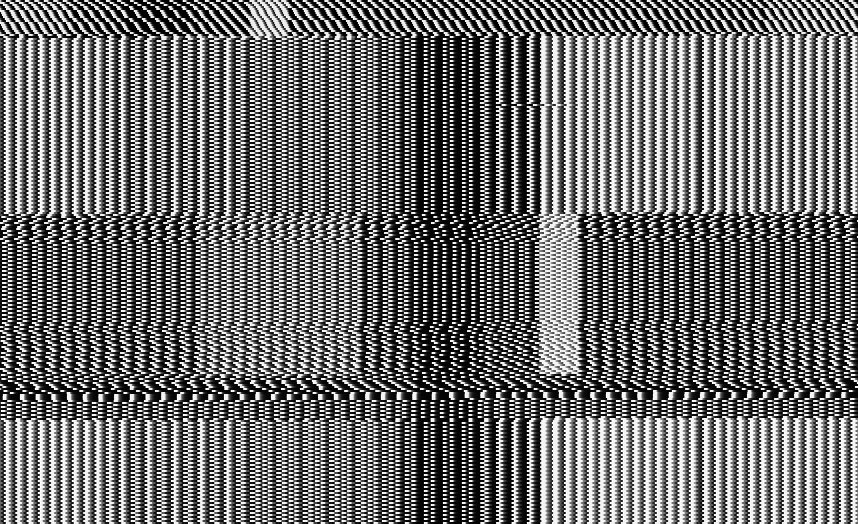
FIG. 7 — Deep saturation. 2.2nF; the bend is most of the signal now.
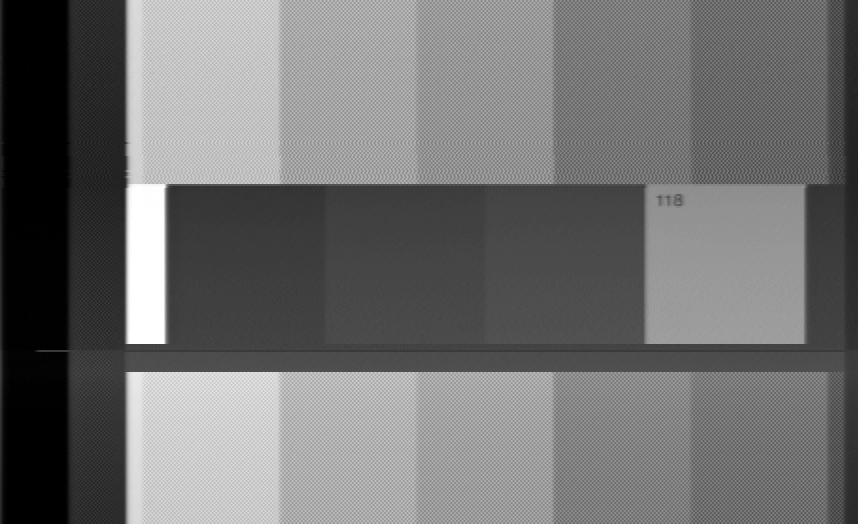
FIG. 8 — The opposite direction: the cream softening bend, measured at −94% high-frequency energy. 2.2nF.
There is no FIG. for the sweet-spot signal decoded in color. It cannot exist; the decoder returned nothing. A signal too bent to decode and still willing to be displayed is the best one-line definition of a sweet spot I have. The CRT is the only instrument that can testify to it — which is why there is a camera pointed at one.